The Hidden Cost of Dormant Customers (and a Worksheet to Size It)
A churn has a date. A dormant account just sits there, counted as healthy, costing money in four separate ways.
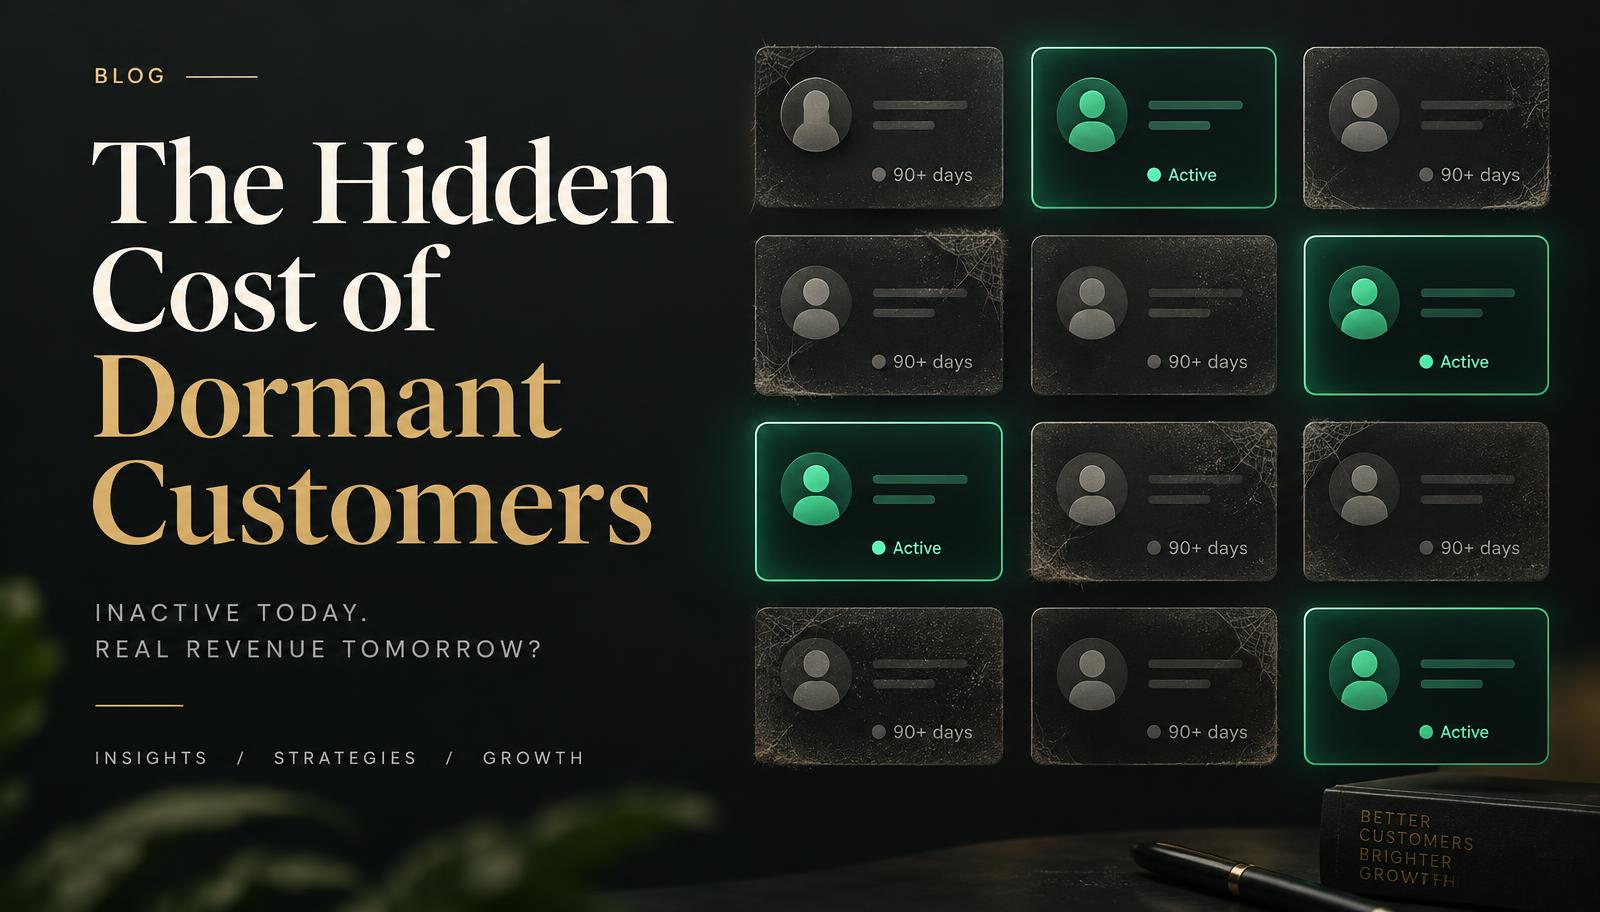
Dormancy is the most under-counted line in your revenue because it never produces an event. A churn has a date. A dormant account just sits there, counted as healthy, costing money in four separate ways.
This playbook walks through the four costs, then gives you a worksheet you can fill in this week.
The four ways dormancy costs you
- It corrupts the forecast. Dormant accounts stay in the base, in the renewal projection, and in net revenue retention until the quarter they don't. Every forecast built on them is wrong in the same direction.
- It eats selling time. Reps work accounts that won't respond because the CRM says they're active. Time spent on a dormant account isn't neutral. It's time not spent on an account that would have closed or expanded.
- It costs money to hold. Per-record CRM and enrichment costs, sales tool seats, and marketing sends to contacts who are no longer there. Contact data goes stale every year as people change jobs, so a database nobody prunes is paying to store a picture of the market that gets more wrong every month.
- It hides the real churn signal. When dormant and active look the same in the system, you can't compute a decay rate, so churn stays reactive.
A worksheet you can fill in this week
| Line | How to compute it | Your number |
|---|---|---|
| Dormant records | Accounts or contacts with no meaningful activity in 90+ days | |
| Holding cost | Dormant records × your per-record CRM, enrichment, and tool cost per year | |
| Selling time cost | Rep hours per month spent on dormant accounts × fully loaded hourly cost × 12 | |
| Revenue at risk | Dormant accounts still paying × their annual contract value | |
| Forecast distortion | Revenue at risk as a percentage of the renewal forecast |
Add the first three for the annual cost of doing nothing. Read the last two as the size of the window you still have to act. Neither number needs new tooling. Both come out of systems you're already paying for.
A worked example
These numbers are made up to show the math. Swap in your own.
- Dormant records: 400 accounts with no meaningful activity in 90+ days.
- Holding cost: 400 × $20 a year per record = $8,000.
- Selling time cost: 10 rep hours a month × $60 an hour × 12 = $7,200.
- Cost of doing nothing: $8,000 + $7,200 = $15,200 a year, before you count a single lost deal.
- Revenue at risk: 25 of those accounts still pay $6,000 a year each = $150,000.
- Forecast distortion: against a $1,000,000 renewal forecast, that's 15 percent of the number you're presenting that may not show up.
The one thing that changes the picture
Write down what "dormant" means, in one sentence, with a threshold, and apply it the same way everywhere. For example: "An account is dormant when no user has logged in and no one has replied to us in 90 days." Until the definition exists, the cost is unmeasurable and therefore unmanaged.
Your next step
Fill in the worksheet with your own numbers, then share the definition with sales and CS so they count the same way. If dormancy is one symptom of a bigger handoff problem, the Revenue Bottleneck & Leak Audit will show you which systems are breaking. For the full list of leaks and their fixes, see the revenue leakage playbook.
Rather not map it yourself?
The 90-day GTM Strategy gives your team a full revamp plan for your GTM engine: lead acquisition, the right channels to go after, product marketing, and the right ICP. It goes past SEO rules of thumb and looks at every revenue leak across your GTM.
Get my 90-day GTM planShare this issue