Why Every Team Reports a Different CAC
Why Marketing and Sales credit the same customer differently, how to work out the traffic you actually need, and why a founder's close rate rarely survives the first hires.
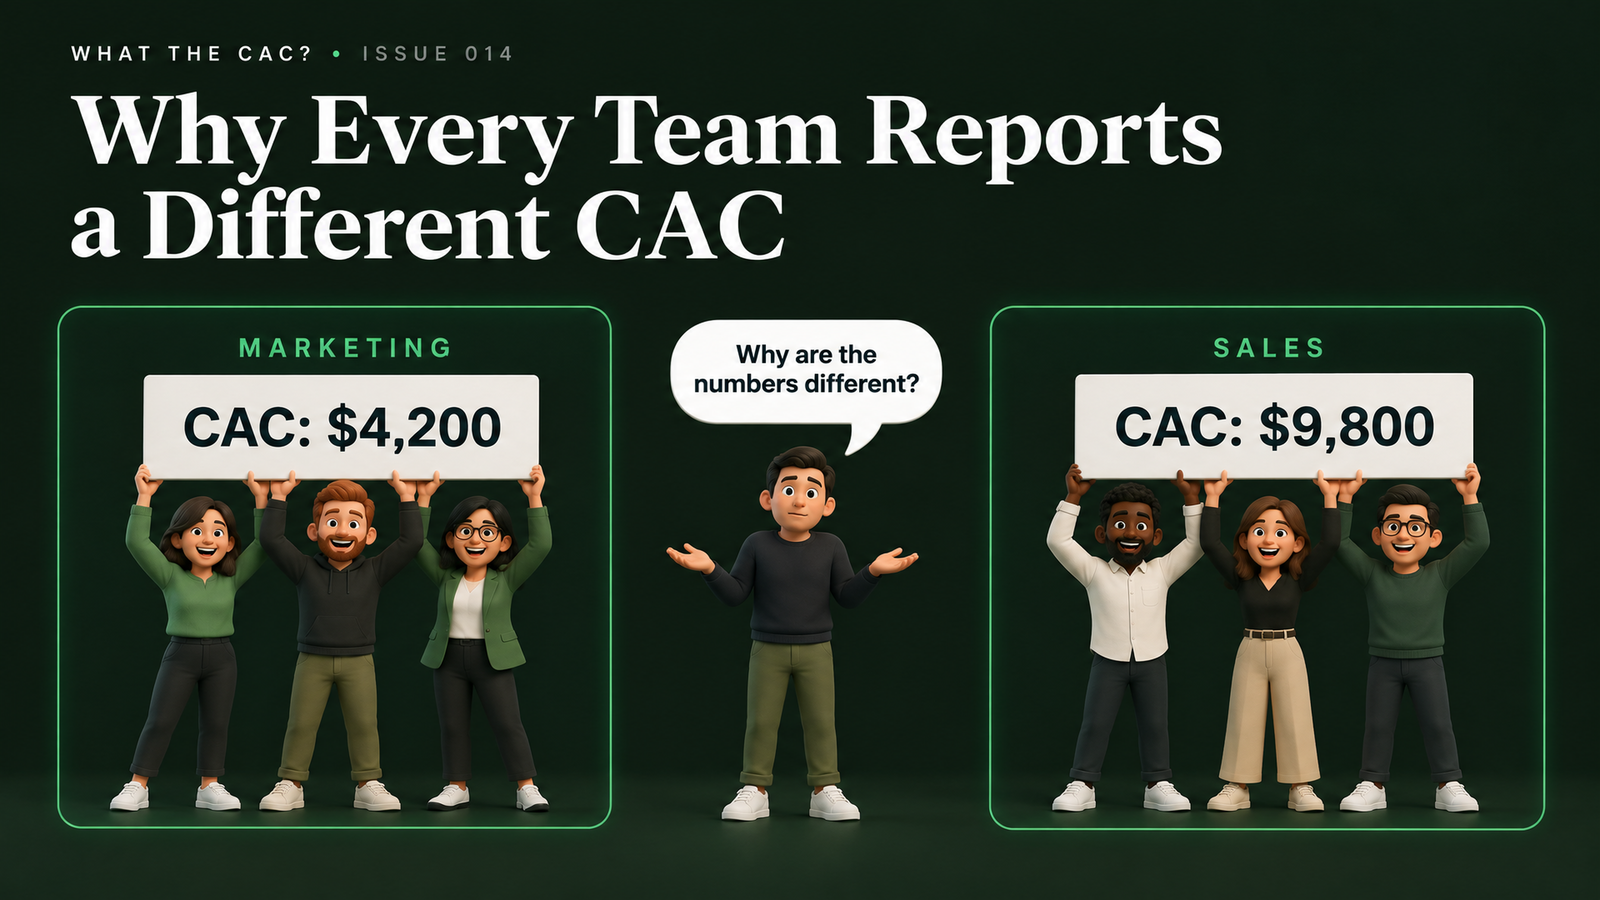
This week's focus is on how credit and measurement shape your CAC, because the number you plan around depends on which team built the report.
I'll cover why a dashboard can credit the wrong team, how to work out how much traffic you really need to hit a deal target, and why a founder's close rate rarely survives the first few hires. All three come down to the same question, which is whose version of the numbers your budget is built on.
I've been on both sides of the monthly reconciliation between Marketing and Sales. What I took from it is that the number that wins the meeting is not always the right one.
Why does your dashboard credit the wrong team?
Most dashboards show influence from the point of view of whoever built them. When Marketing and Sales measure with different tools and different rules, each report can be consistent on its own and still disagree with the other.
Here is a scenario I see often. A lead was touched once by Sales years ago and never worked again. Later the same person comes back with a new title at a new company, finds a marketing asset, and converts through the website. Marketing changes the source to inbound, and Sales objects that the lead was theirs.
The mirror image happens with event leads that take years to close. Marketing records the event as the source, then keeps the buyer warm with nurture emails until they finally book a demo. Sales closes the deal and takes the credit for the logo. Both teams did real work, and each report tells the story that favors the team that wrote it.
The data makes it worse. Marketing often blends several measurement tools, while Sales treats the CRM as the source of truth, even though the CRM can't see everything the other tools see. So each month the two teams reconcile, hunt for the anomaly, and sometimes accept the other side's number just to move on. The board sees totals that add up, and the people who built them know part of it was a guess.
“I've been on both sides of that reconciliation. The number that wins the meeting isn't always the right one.”
This matters for CAC because credit decides which channel gets the wins that its spend is divided by. Suppose Sales claims every deal that closed in a quarter. Marketing's cost per customer then looks enormous, and the first budget cut often lands on the programs that built the awareness in the first place. Brand and nurture spend tend to go first because their influence is the hardest to show, and the pipeline weakens a few quarters later. When credit is political, a team can cut spend that was working and add to spend that only looks like it is.
Related: stackfinder.com/answers/conversion-rate-optimization
What is lead source attribution?
Lead source attribution is how you record the channel that first brought a lead in, and how you credit the later touches that helped it convert. Keeping the original source fixed and logging later touches separately keeps both views visible.
The lead source field should stay fixed once it is set. Contributions after that, such as nurture emails or sales outreach, belong in a separate record of touches, so credit can follow the activity that actually moved the buyer.
A simple way to apply it is to keep two records. One holds the original source and never changes. The other holds the later touches, so Marketing's nurture and Sales' outreach both show up. When a person returns years later at a new company with no sales activity in between, a new record with its own source is fairer than letting an old outreach touch claim the win.
Related: stackfinder.com/answers/lead-source-attribution
How much traffic do you need to hit your deal target?
Work backward from signed deals. Count the demos, discovery calls, and opportunities behind each deal, and how long each step took, and you will see how much top-of-funnel you need before you spend more on ads or events.
Most plans run the other way. They start with a budget, estimate the leads it will buy, and hope the deals follow. Planning from the bottom up is more honest. Start with the deals you actually signed last quarter. For each one, count backward through the demos it took, the discovery calls behind those demos, the opportunities behind those calls, and the visitors behind those opportunities.
Then record how long each step took. Conversion rate tells you how many you need at each stage, and speed tells you when you need them. Together they show what a quarter of pipeline really requires.
For illustration, suppose one in three demos closes, one in two discovery calls reaches a demo, and one in four opportunities reaches a discovery call. A single signed deal then needs about three demos, six discovery calls, and twenty-four opportunities. If one in fifty visitors becomes an opportunity, that is roughly twelve hundred visitors behind each deal. Those ratios are made up, so use your own.
What the example shows is how the stages stack. Each one multiplies the one before it, so a small drop at any stage becomes a large change at the top. Once you know how many visitors a deal takes, you can also work out what a visitor is worth, which sets a ceiling on what it makes sense to spend to attract one.
“If I could only run one exercise with a growing company, it would be this one.”
What is pipeline velocity?
Pipeline velocity measures how quickly your pipeline turns into revenue, calculated as the number of opportunities multiplied by average deal value and win rate, divided by the length of the sales cycle.
It combines the same ingredients as the bottom-up exercise, which are how many, how often they convert, and how long they take. A rise in any of the first three, or a drop in cycle length, speeds revenue up.
For illustration, a team with 40 open opportunities, an average deal value of $20,000, and a 20% win rate, working a 100-day sales cycle, has a velocity of 40 × $20,000 × 0.20 ÷ 100, or about $1,600 of revenue per day. Those numbers are made up, so use your own.
Each input is a lever. More opportunities, larger deals, and a higher win rate all raise it. A shorter cycle raises it too, and because the cycle sits in the denominator, shortening it can be the cheapest lever, since it doesn't require any extra pipeline.
Use it to compare quarters or segments rather than as a single target. If velocity is flat while traffic grows, the pipeline is getting bigger without getting faster, and the bottleneck is usually a stage in the middle rather than the top. Pair it with stage-by-stage conversion rates to find where deals slow down.
It matters for CAC because a slower pipeline means more sales cost for every closed deal, which is the same cost-per-win pressure behind everything else in this issue.
Related: stackfinder.com/answers/pipeline-velocity
Why doesn't the founder's close rate transfer to new hires?
Much of what makes a founder close deals lives in the founder's head and never made it into the process. A new rep inherits the pipeline but not that knowledge, so the founder's close rate rarely carries over.
A founder knows the product, the customer, the objections, and what is safe to promise. None of that is written down, and it is why the founder can close at a rate that looks repeatable on a spreadsheet. If the hiring plan is built on that rate, it breaks in the first quarter the new reps work on their own.
It is rarely one big secret. It is a hundred small judgment calls, such as which questions to ask in discovery, which customers to walk away from, what is safe to promise about the roadmap, and how to answer the pricing objection. The founder makes those calls without noticing, which is why they never get written down.
The cost lands in CAC. If new reps need more opportunities per deal than the model assumed, their salaries are spread across fewer wins, and acquisition looks worse than planned. That is the moment it gets blamed on the lead engine, when the plan was built on a number nobody else could produce.
“A founder's close rate is a great sign the product works. It is a poor forecast for a team that doesn't have the founder's context.”
The fix is to reverse engineer the process before scaling it. Listening to recorded founder calls is the fastest way to find what is missing. Pull out the questions, objections, and proof points that keep recurring, and turn them into a short playbook. Then let new reps run on their own for a full quarter, measure their conversion separately, and plan the next hire against what the last one achieved, not what the founder achieved.
Who should own the reporting?
One person or team should own the shared definitions and the combined report, so Marketing and Sales aren't each reconciling their own numbers. Both teams can keep their own views, but they should start from the same data.
When every team builds its own dashboard, each one bends toward its own contribution without anyone intending it. A single owner, usually RevOps, can write down what counts as a lead, how source is set, and when credit changes, then connect the tools so the CRM sees what the others see. Both teams review the same report each month, and the board gets one number with a short note on how it was built.
The definitions document doesn't need to be long. It should say what counts as a lead, what counts as qualified, how source is set and when it can change, and which date a new customer is credited to. When two numbers still differ, show both with a short note on why, since a visible difference is easier to trust than a hidden one. RevOps is the natural owner, but only if leadership gives it the authority to settle disputes, not just the job of pulling reports.
A quick test is to ask three leaders for last quarter's new lead count. If you get three different answers, you don't have a reporting problem so much as a definitions problem. A CAC built on a lead count nobody agrees on is a guess, and budgets get decided on it.
What should you do this week?
Three checks, each under an hour.
- Ask three department heads for last quarter's new lead count, and write down every number you get.
- Take last quarter's signed deals and count backward through demos, discovery calls, and opportunities, then note how long each step took.
- Look at your oldest closed-won deals and check whether the lead source in the CRM still reflects where the buyer first came from.
All three test whether the CAC your team reports is built from one set of facts.
Reply and tell me what you found.
Share this issue